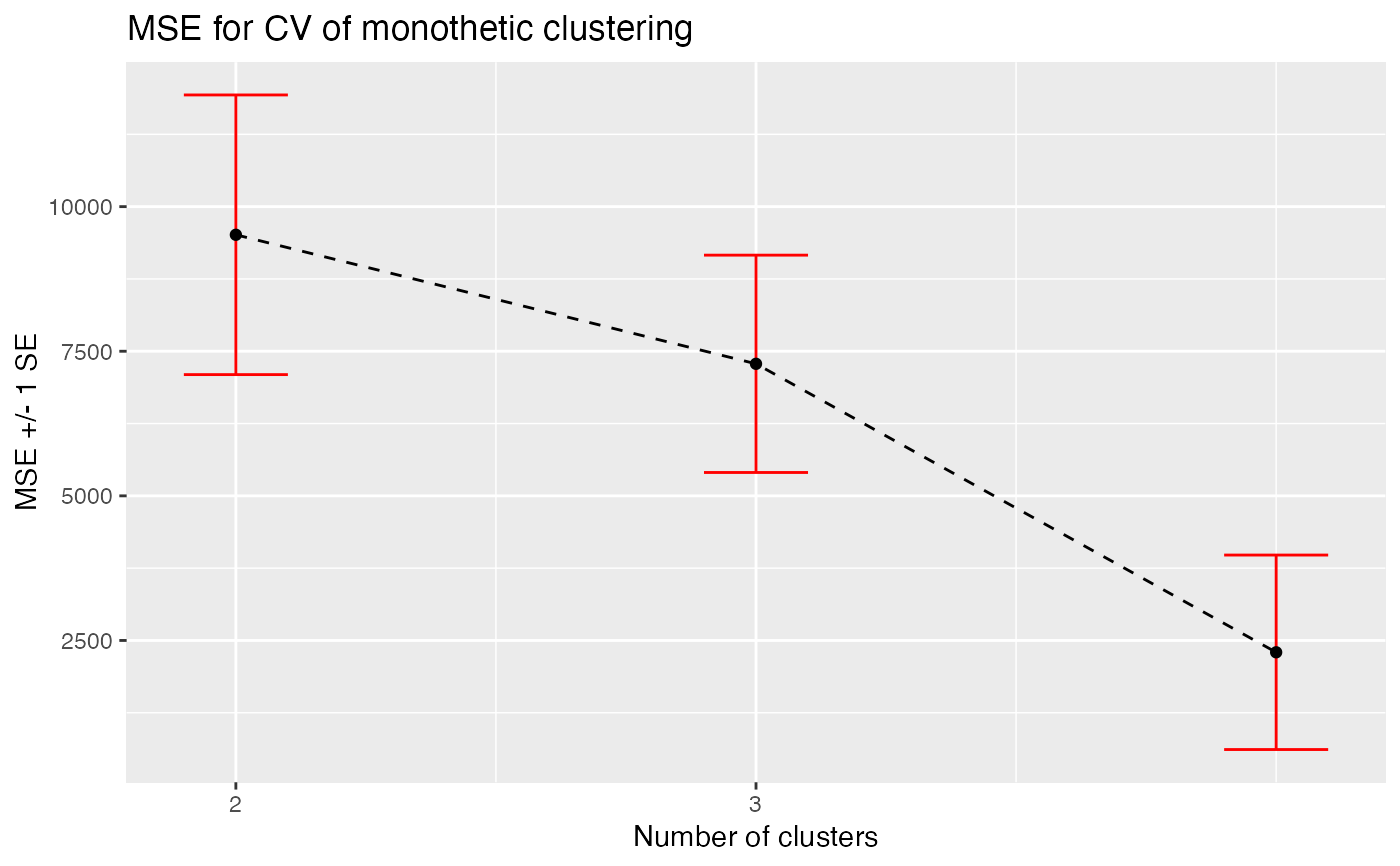
GGPlot the Mean Square Error with Error Bar for +/- 1 Standard Error
ggcv(
  cv.obj,
  title = "MSE for CV of monothetic clustering",
  xlab = "Number of clusters",
  ylab = "MSE +/- 1 SE",
  type = c("b", "p", "l"),
  linetype = 2,
  err.col = "red",
  err.width = 0.2
)
Arguments
| cv.obj | A |
|---|---|
| title | Overall title for the plot. |
| xlab | Title for x axis. |
| ylab | Title for y axis. |
| type | What type of plot should be drawn. Choosing between |
| linetype | The line type. See |
| err.col | Color of the error bars. |
| err.width | Width of the bars. |
Value
A ggplot2 object.
See also
Plot using base R plot.cv.MonoClust()
Examples
# \donttest{ library(cluster) data(ruspini) # 10-fold cross-validation cptable <- cv.test(ruspini, minnodes = 2, maxnodes = 4) ggcv(cptable)# }